Put your Facebook reports on autopilot!
Generate reports and dashboards with key Facebook metrics.
Track your growth, engagement, competitors, ad campaign results, and much more!

We do not ask for credit card. We do not SPAM
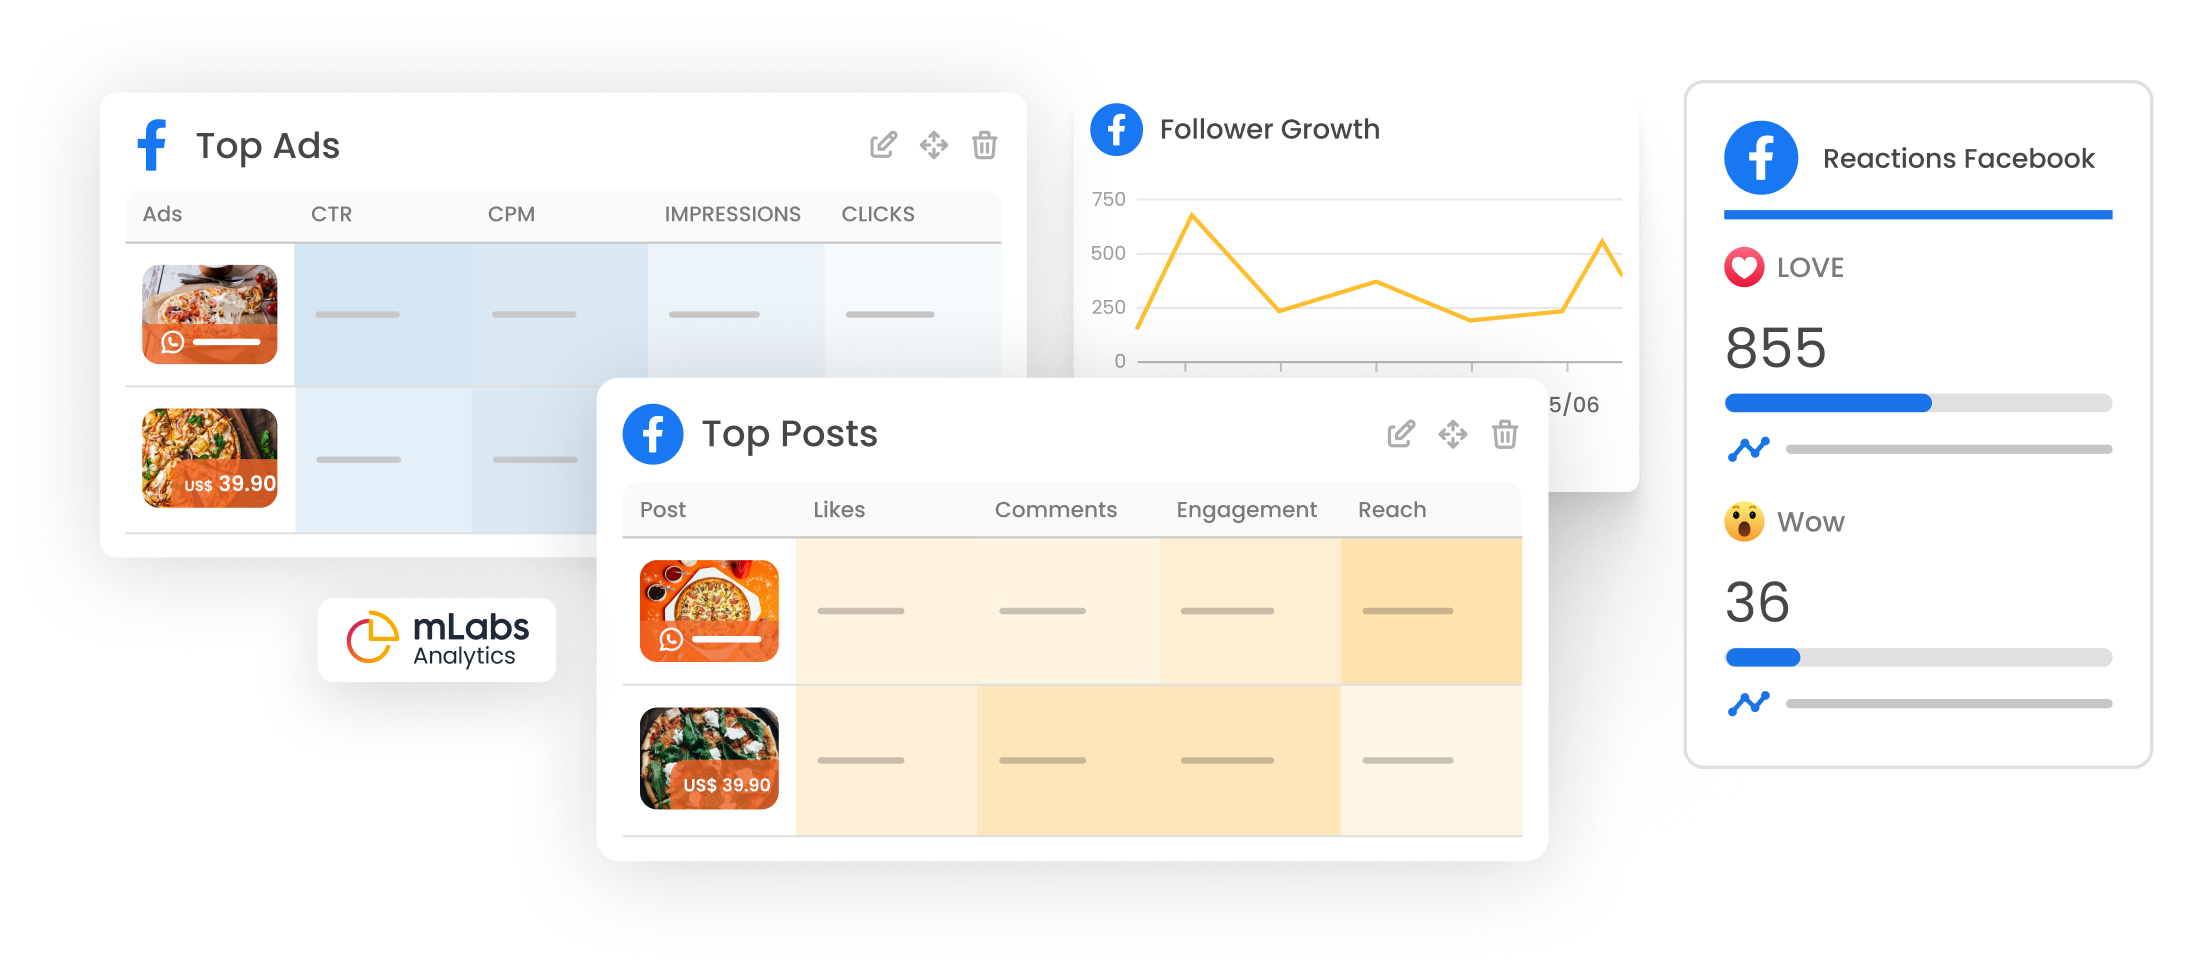
Access all Facebook metrics, monitor your performance, and get to know your followers
Generate reports and dashboards to analyze Page growth, monitor ad campaigns, track follower gains and
losses, and gain a deep understanding of your follower profile.
Generate reports and dashboards for Meta Ads
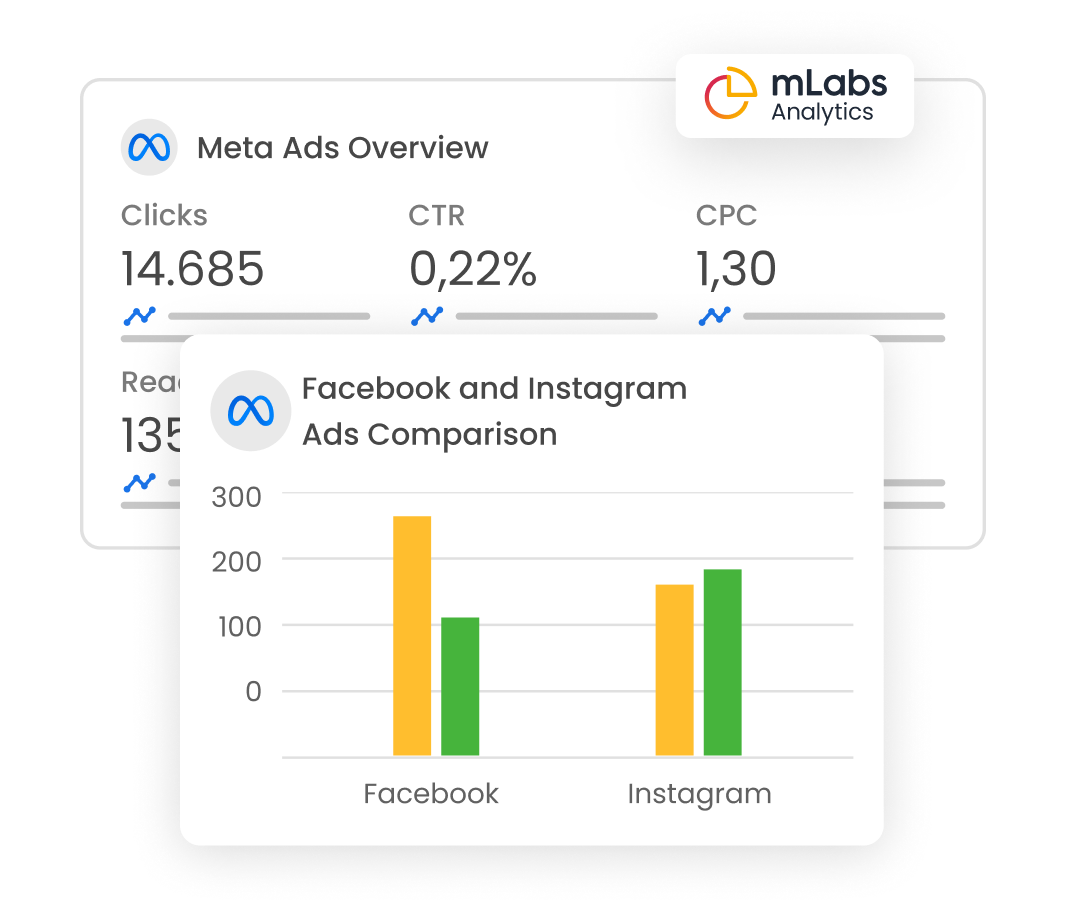
Use mLabs Analytics to generate reports and dashboards and monitor your ad campaigns on Facebook!
Analyze costs, CTR, CPM, CPC, and make optimizations based on data you can access in just a few clicks.
Reach and Engagement
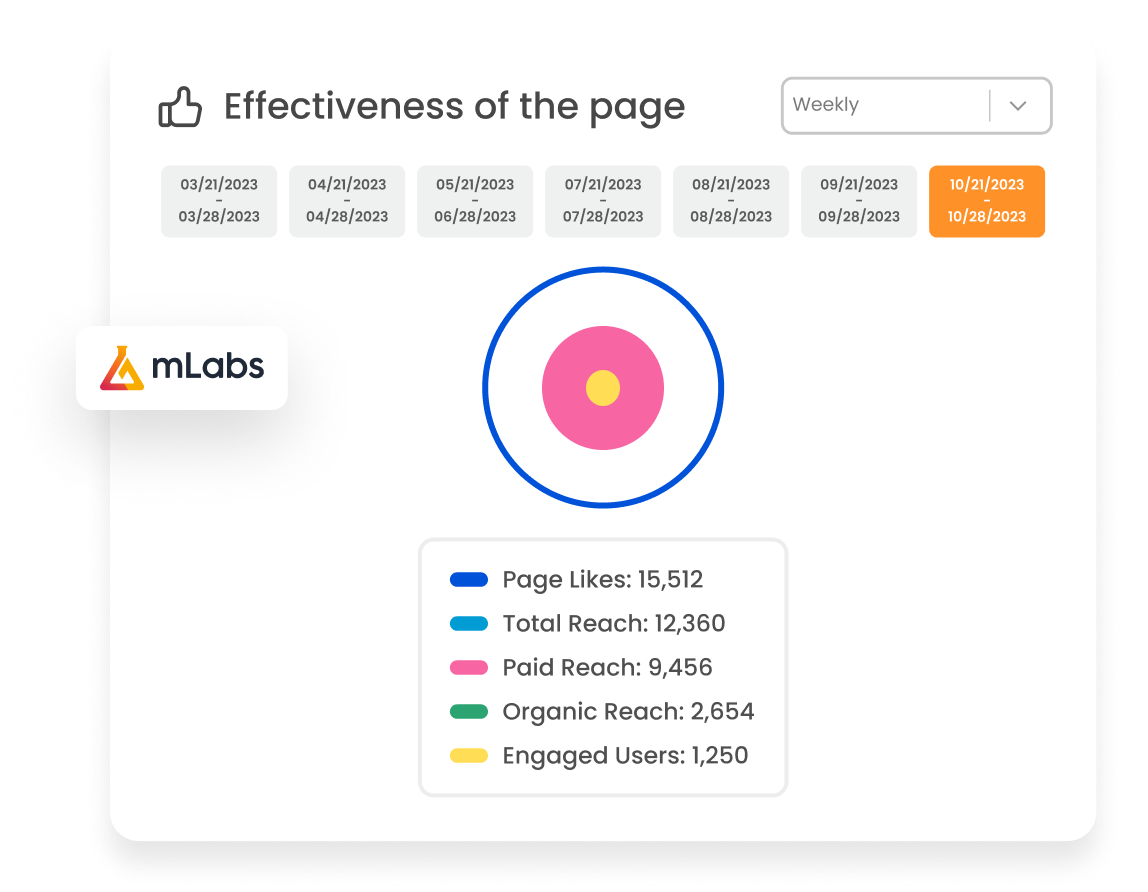
The Page Effectiveness graph details the paid and organic reach of
your posts, shows the percentage of users engaged with your
content, and the page engagement rate.
Take advantage of customized reports and dashboards
from mLabs Analytics
Available in the Full Plan
Customization
Add logos, integrate spreadsheets, and more! There are numerous features to customize reports and dashboards with mLabs Analytics.
Automated Sending
Choose one of our report templates and schedule recurring deliveries, specifying the frequency and who should receive the report by email.
Client Portal
A personalized and secure website (with login and password access) for your agency to share dashboards with clients.
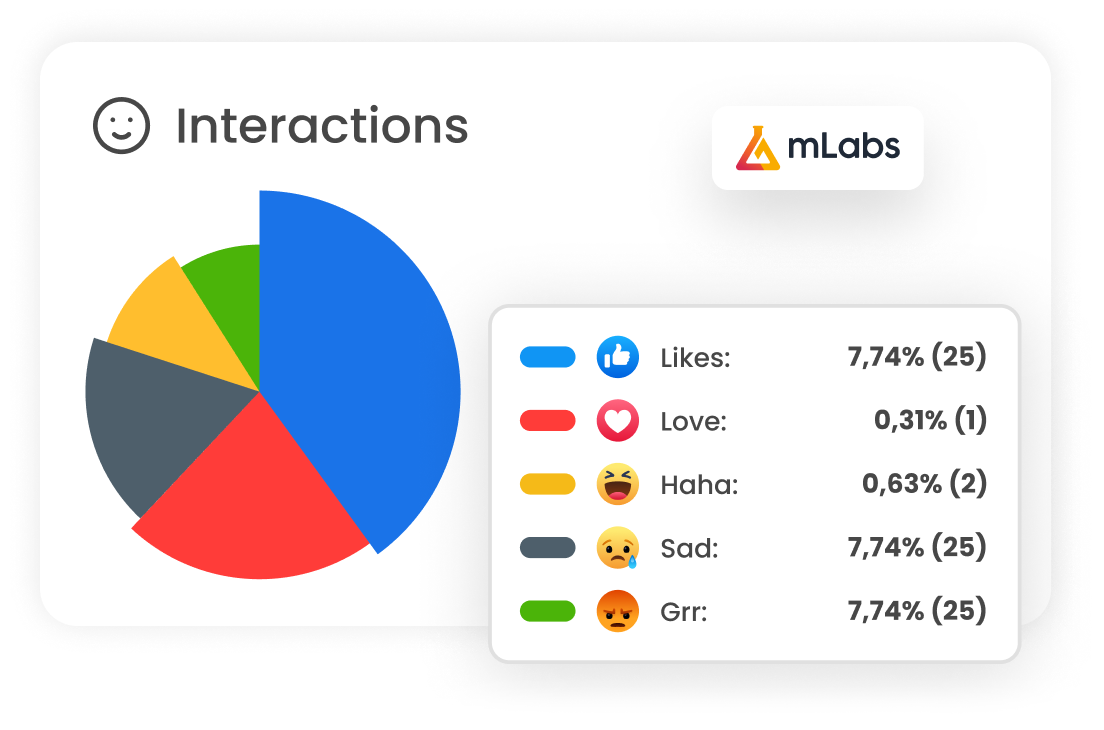
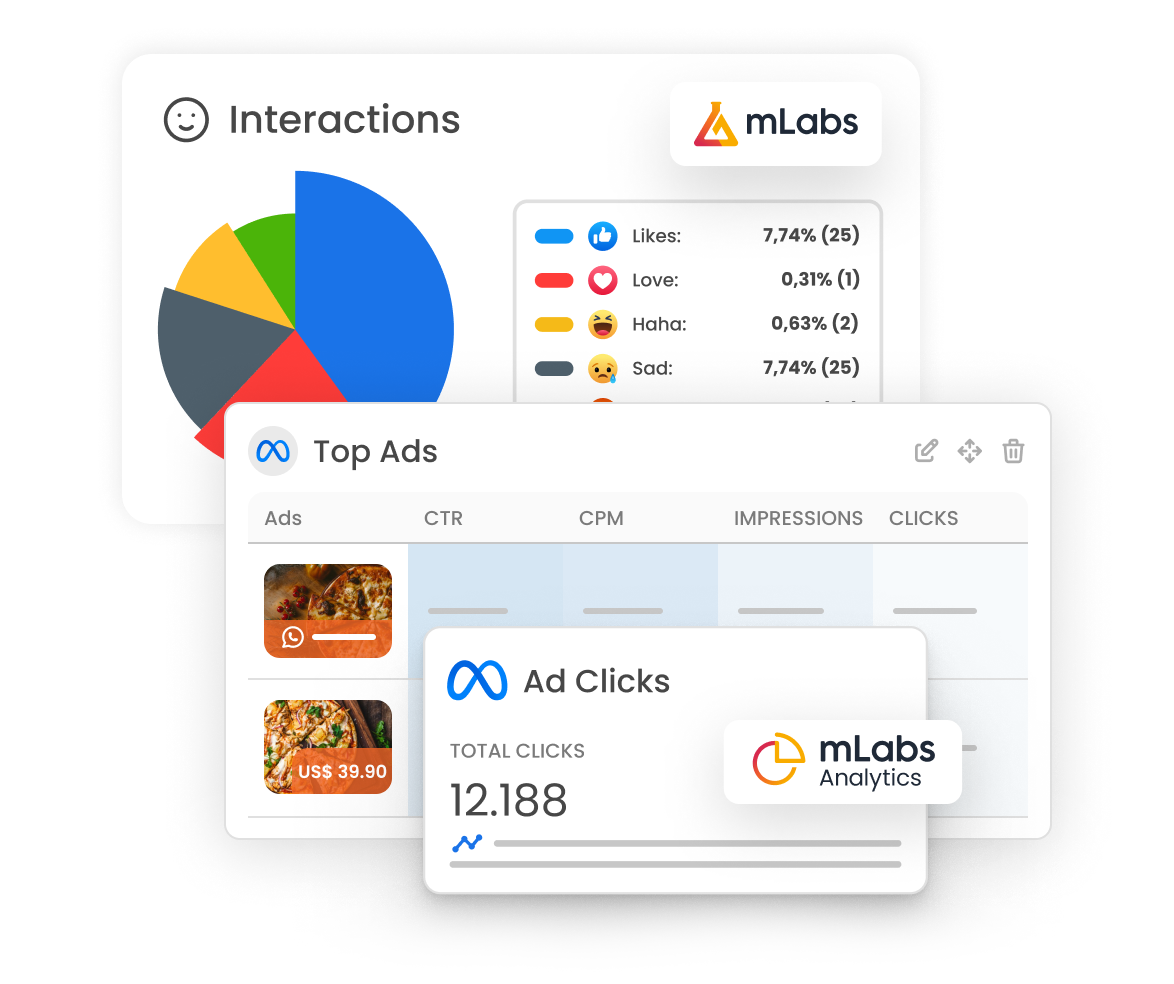
Interactions
See in detail how many clicks, likes, reactions, comments and shares
the Fanpage received in customized periods.
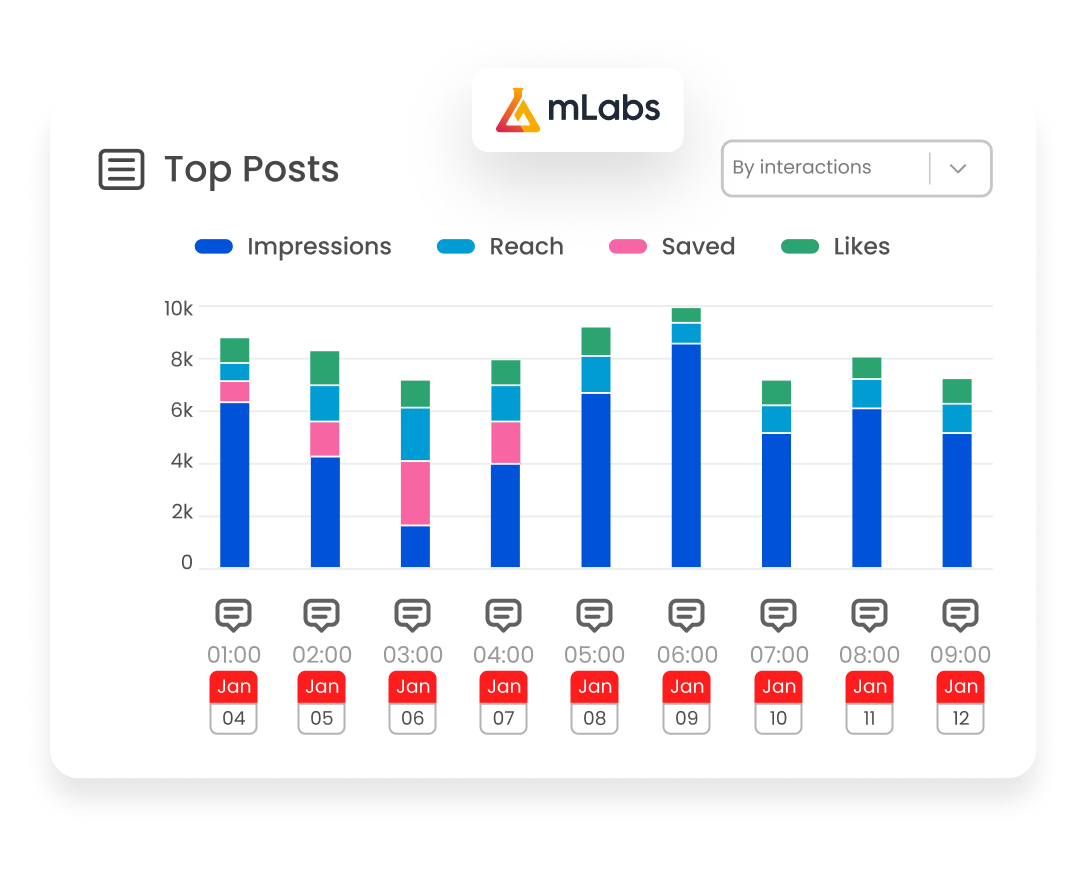
See the best posts of the moment
and optimize your strategy!
Betting on what works is the simplest form of optimization in Marketing.
The mLabs Best Content graph shows you your best posts by engagement or interactions, detailing the interactions for each post. This chart provides valuable insights into your audience’s interests and seasonality.
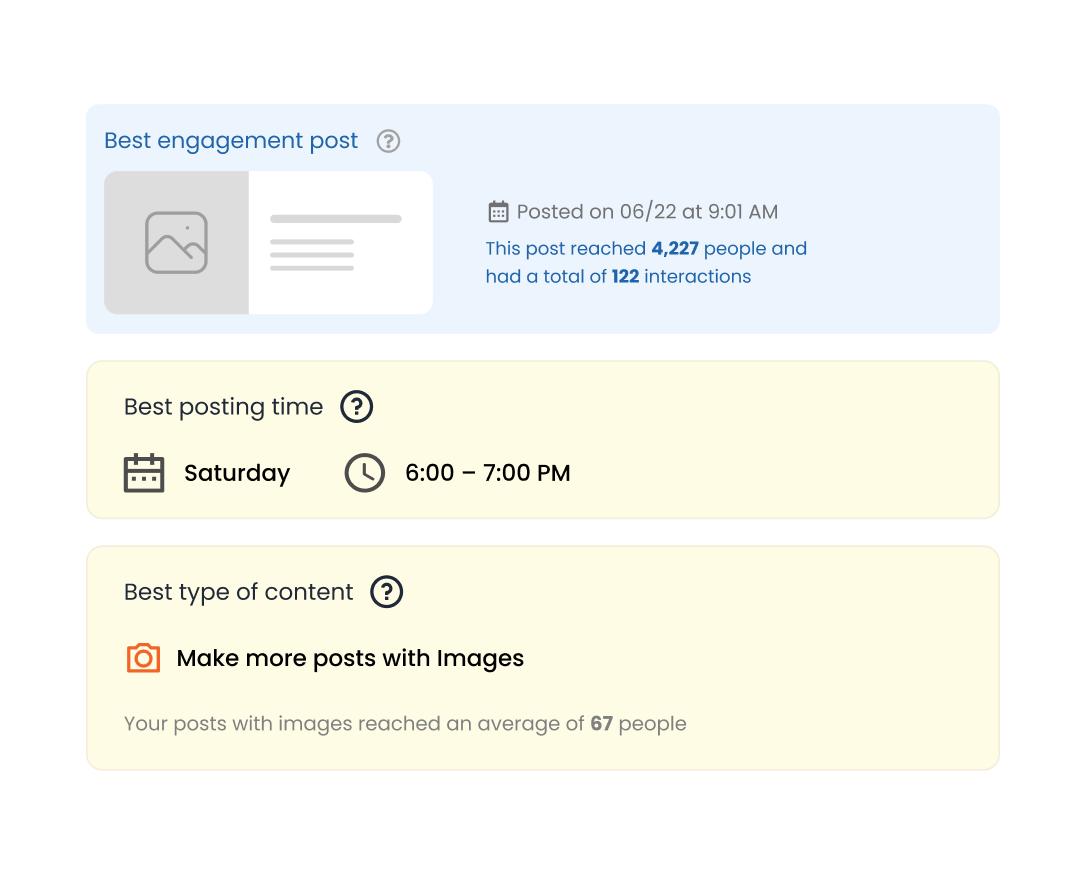
Exclusive Tips
In addition to providing information in a clear, simple and intuitive way, mLabs also helps you with exclusive tips.
Learn the best days and times to post on Facebook, always according to the behavior of your followers.
You can also find out what is the best type of content to post.
Starts at US$ 12.90/month!*
Test mLabs with unlimited brands, users and reports!
We do not ask for credit cards. We do not do SPAM
*Equivalent monthly price for the annual subscription of the Beginner Plan for one brand.
